
×
info@m2today.com
jobs@m2today.com
investments@m2today.com
WELCOME TO THE LABORATORY OF CREATIVITY, INNOVATION AND DIGITAL SOLUTIONS
TECHNOLOGY.
The keys for technology development are social behavior, economic data and behavior patterns, trends, demand, supply, big data, statistics, analytics, science, culture, time.
Machine Learning tasks
Brief picture. Basics as in the PhD thesis.
Scientific tasks and tools for economic development
Machine learning is a field of science that studies how to extract knowledge from observed data.
Machine learning (ML) is a relatively new discipline, and its terminology is not yet established.
Machine Learning is a field which emerged as an intersection of three other fields: statistics, computer science and optimization.
Machine Learning is a tool to make the past data useful to solve today and future tasks.
The field of machine learning is very broad. There are different models for a single task and for the different tasks.
Models can be classified in several different ways.
One way to classify machine learning models is inherited from statistics.
- There is a frequentist and Bayesian approach to machine learning.
- Models can be divided into probabilistic and deterministic.
There are pros and cons of different models choosing for the practical situations.
The task is to find and develop the most suitable model.
Useful:
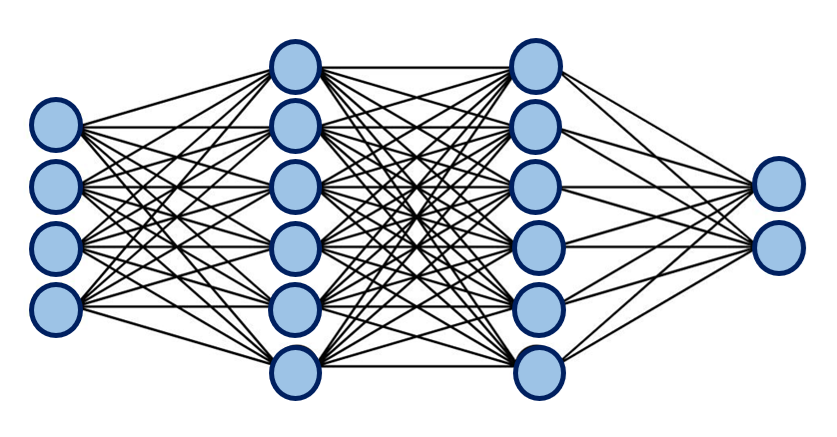
- Randomly-weighted random networks which are also called Extreme Learning Machines.
- Temporal Gaussian processes and state-space models.
The time dimensionality of the data gives benefits for tasks that could be solved in other ways.
Models are used as blocks for complex tasks solving.
These tasks are :
- Spatio-temporal models.
- System identification.
- Reinforcement learning.
The improvement of models takes time and needs data.
Two different ways to approach the task solving:
1. Regression.
2. Imputation of missing values.
Building of optimal ensemble of approaches is the way to:
1. Develop approaches.
2. Improve the correlations between parameters.
1. Regression.
2. Imputation of missing values.
Building of optimal ensemble of approaches is the way to:
1. Develop approaches.
2. Improve the correlations between parameters.
Model selection is one of the central topics in machine learning.
The marginal likelihood (or evidence) optimization can be used for probabilistic models, while cross-validation or bootstrap procedure are usually exploited for non-probabilistic models.
The data modeling may be started from the probabilistic model. This model describes the relationships between variables in the data and may include unobserved latent variables. The probabilistic model is a compulsory component in the Bayesian approach to statistics, however, it is NOT MUST in frequentist approach.
There are supervised and unsupervised learning.
Supervised learning.
It consist of input variables and output variables. The task is to learn the dependency between inputs and outputs which predicts the corresponding output for any new input observation.
Two most typical cases in supervised learning are classification and regression.
The measurements in the dataset can be noisy. The methods which learn the dependency may take this into account. Probabilistic model is one way to incorporate this noisiness into the mapping between inputs and outputs.
Unsupervised learning.
In the unsupervised learning the dataset consist only of one set of variables. The purpose of this task is to find some hidden structure or pattern in the data.
In clustering the aim is to map each data point to some cluster. The clustering problem is similar to the classification, except that clustering is completely unsupervised.
In the probabilistic clustering the values of interest are probabilities. In a different approach the inputs are mapped to a latent space. The most known latent variable model is Principal Component Analysis (PCA). The computationally efficient and stable way to compute PCA is via Singular Value Decomposition (SVD).
Missing values problem.
The missing value problem is like some intermediate task between supervised and unsupervised tasks.
1. We estimate missing values which is more similar to the supervised task.
2. We devise an algorithm which is able to perform latent variable model with missing data.
Then the missing data can be filled by projecting back from the latent space.
Time series prediction.
Time series (TS) prediction and modeling. Time series is a sequential data where the order of samples plays an important role. A general type of time series models consists of two type of variables. The first component models the latent/non-observed process. The second component models the observations of the time series and is linked with the first component. Noise terms allow taking into account the uncertainty. Uncertainty is important for time series prediction because it improves the decision making for the future observations.
Time series (TS) prediction and modeling. Time series is a sequential data where the order of samples plays an important role. A general type of time series models consists of two type of variables. The first component models the latent/non-observed process. The second component models the observations of the time series and is linked with the first component. Noise terms allow taking into account the uncertainty. Uncertainty is important for time series prediction because it improves the decision making for the future observations.
Model selection and combination
It is possible to select several different models for predicting the output for given data.
It is possible to create new models for predicting the output for given data.
What we need to do is to check the results of predicting. Getting closer and closer to obtaining the best result of the model calculation is the task of developing a model for a selected data stream.
Processing big data in multi-stage model calculations is a resource-intensive operation. It requires powerful computers, significant time investment, and convenient storage.
Therefore, resource and performance costs must be taken into account. Performance requirements influence the choice of model and may also motivate the choice of variables.
However, the predictive power of a combination of models is better than the predictive power of individual models. If the focus is limited only to forecasting accuracy, then it is preferable to consider a combination of models.
Model selection is directly related to the complexity of the model. The best performing model has the optimal complexity. A model that is too complex leads to overfitting. Conversely, a model that is too small leads to underfitting.
The choice of the class of methods to be used is determined by many criteria, including ease of optimization, speed of training and prediction, and ease of uncertainty assessment.
Contact us to get more information.
It is possible to create new models for predicting the output for given data.
What we need to do is to check the results of predicting. Getting closer and closer to obtaining the best result of the model calculation is the task of developing a model for a selected data stream.
Processing big data in multi-stage model calculations is a resource-intensive operation. It requires powerful computers, significant time investment, and convenient storage.
Therefore, resource and performance costs must be taken into account. Performance requirements influence the choice of model and may also motivate the choice of variables.
However, the predictive power of a combination of models is better than the predictive power of individual models. If the focus is limited only to forecasting accuracy, then it is preferable to consider a combination of models.
Model selection is directly related to the complexity of the model. The best performing model has the optimal complexity. A model that is too complex leads to overfitting. Conversely, a model that is too small leads to underfitting.
The choice of the class of methods to be used is determined by many criteria, including ease of optimization, speed of training and prediction, and ease of uncertainty assessment.
Interactions
Brief picture. Basics as in the PhD thesis.
Social Behaviour in Network systems.
We live our lives through interactions with other people. These various forms of interaction are both
networked and permeated with layers of social behavior.
Network science provides a useful framework for analyzing systems of interactions by representing them as networks – mathematical objects that we can analyze, approximate, and manipulate using methods from statistical physics and computer science.
Common view: The focus on interactions provided by network science allows us to zoom into auto-recorded contacts created by mobile phone calls, emails, social media platforms or proximity data, revealing rich behavioural patterns for individuals and groups.
However, neither interpersonal relations nor group identities are physical objects that we can measure. To this end, a central question in computational social science is how to characterise such social behaviour and how to detect it and its networked effects.

Methods for network science provide statistical frameworks of inference, as well as rich
methodologies for modelling patterns of interaction in large systems.
By using a combination of data analysis, modeling, and a wide range of inference frameworks, we can contribute to the usefulness of huge automatically recorded datasets and mechanistic models of social behavior.
The approach uses an interdisciplinary approach, borrowing concepts and methodologies from social science, mathematics, statistical physics and data analysis.
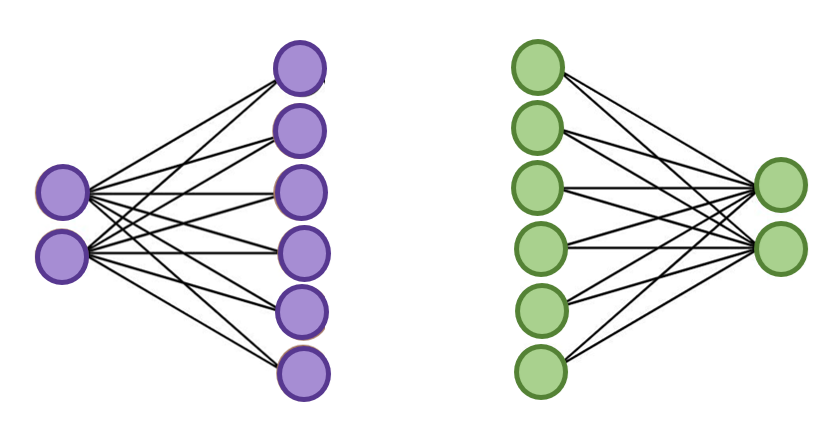
Networks and data.
Networks or graphs are mathematical objects that include a set of nodes that represent agents, actors or people, and a set of edges that represent pairwise relations or interactions between the nodes
The flexibility is one of the reasons why network science has matured into a field of its own: interacting elements exist in neuroscience, economies, the Internet, and society.
Networks vary in structures and dynamics, which have distinct meanings and implications for different processes.
Data sources are thus an essential part of social network analysis, as they largely determine what we can ask and understand about the phenomena or social system we want to study.
Major categories of data sets.
Surveys.
While survey methods are liable to the participant’s memory and mood, they are a valuable source of information on the nature of relationships as they are perceived by the participants including social roles, emotional support or hierarchies.
Communication metadata.
Communication metadatasets can been used both as descriptors of large-scale communications systems that involve many real-life relationships, but also for characterising behavioural patterns at personal and dyadic levels.
Other communication datasets include metadata from emails and text messages.
Proximity data.
In these cases, the social system corresponds to interactions of physical proximity within some social setting, such as a school or an office.
Social media platforms.
Social media platforms are also rich sources of interaction data. The type of interactions available depend on the platform’s infrastructure, such as explicit mutual friendships, sharing other user’s content. The networked structure of social media platforms may differ widely depending on interaction mechanisms.
Other.
We leave this list open as social processes can leave a myriad of different traces. People use different communication channels at specific times of the day to engage with distinct social circles, but also that long-term individual communication patterns are persistent in time and across channels.
Tie and social structures.
In its most simple form, a tie is a mathematical indicator that is zero if there is no pairwise relationship, and one if there is.
Ties can take richer mathematical forms and reflect a wide array of temporal dynamics.
Whether they represent actual lifelong friendships or some minimal online contact, ties may carry information about the social system they inhabit. To interpret that meaning it makes sense to examine the social structures that facilitate social interactions. These structures refer to sociological concepts that attempt to formalise major aspects of human sociality.
Social structures can be reflected in the structure of a network, which also called topology.
Ties as understood by sociology.
Relationships are intangible and expressed through social practice, mutual understandings and interactions, and not through measurable physicality. One way to characterize ties is through formal social roles: kinship, friendship, romantic partnerships, schoolmates, or colleagues.
Since many of roles are not mutually exclusive, the term multiplexity usually refers to relationships that fulfill several social roles or needs.
Learn more about Business Clustering to boost your business.
Learn more how to Grow the Market.
Learn more about Growth Strategy.
Learn more about Digital Wealth.
Learn more how to use your Compound Return.
Learn more how to use your Experience as E-fuel.
Contact us to get access to the Model.
Contact us:
General information:
info@m2today.com
Jobs:
jobs@m2today.com
Investments:
investments@m2today.com